
Happy Tuesday! Thanks for dropping by the Blightmare Dev Blog for this second and final part of a look at cleaning up some garbage that was creating janks. If you haven’t had a chance to read the first part, you can find it here.
We left off with a profile that looks a bit like this:

This shows clearly that GC.Collect is taking up about 70% of our frame time. Finding this on a profiler run is about as good as it gets because there’s a single thing responsible for most of the time. This means it’s really easy to focus on the problem and it should be possible to make significant gains in terms of removing the janks.
In order to do something about GC.Collect, we will need to know what it is. The coloring in the profiler indicates that it is not code that we have written; instead it is system code. This means that the solution will not involve directly modifying the GC.Collect code, but rather modifying how it interacts with our code either by calling it less or doing things differently so that it has less work to do. Pulling up the documentation for GC.Collect reveals that it “Forces garbage collection.” In order to understand what that means I’ll take a brief digression into different types of language runtimes.
There are numerous ways to categorize programming languages. The element that we will look at today is how memory is treated. In some languages such as C or C++, memory management is left entirely up to the programmer. This means that you have all the control you could need over when and how memory is allocated, managed, and ultimately returned to the system. However, that control means that nothing will be done for you and it is possible to leak memory. This means memory that was allocated has been lost without ever being freed. If memory is consistently leaked, the program will consume more and more memory eventually leading to poor performance and then a crash as resources become depleted on the system. This is clearly not something that we want to happen, so great care must be taken to ensure proper memory management. Instead of relying on “taking great care” there is an alternative automatic approach. This is sometimes called managed code. In this scheme, the code itself is run inside some kind of runtime that uses centralized and automated memory allocation and management in a way that can be provably safe from leaks. In the case of C#, the way this is achieved is through a process called garbage collection. Essentially what happens is the system keeps track of every piece of memory that has been allocated and also where that memory is referenced from. Periodically it will look through all this memory to see if there are pieces that are no longer referenced from the user’s code. This memory is now safe to be freed and returned to the system. The GC.Collect function forces this process to happen in the C# runtime.
Now that we understand a bit about what this function is actually doing, we can formulate a plan for what to do about it. We need to be on the lookout for temporary memory that we are allocating and then throwing away. This could be through creating short-lived objects, allocating arrays, or even doing string operations. Anywhere that we use “new” or call a function that gives back something that is new is a possible candidate. Looking through all our code to find everywhere that an allocation is made is quite a tedious process to do manually, and using memory isn’t something we can just not do, so there will be many “false positives” here. In the general case there are tools that automatically track where allocations are made and can show nice visualizations for hot spots. In our case however, it’s highly suspicious that the GC function occurs in a call stack with our IMGUI class every time. Let’s take a look.
The IMGUI class in Blightmare provides the functionality to do the debug drawing for the player’s position history, various collision boxes and any other kind of drawing that we want to be able to do to show how mechanics are behaving. In order to do this, we collect a big list of everything that anyone wants to draw for the frame and then build a dynamic mesh to render it all. As you might imagine, this ends up using lots of memory, so this is definitely a hot spot for memory allocations in Blightmare and if all goes well, the cause of our GC problem.
I opened up the code and immediately saw 2 things that could be causes of this. Each time an element is added to be drawn, we allocate a new piece of memory to record what to do later. This is silly because each of the records looks the same, so we wouldn’t need to throw them away after using them once. Instead, we can keep them around and reuse them over and over only allocating new ones if we run out of entries from before. This is a technique called pooling and is very common in dealing with managing the garbage collector. All we do is keep a list of every entry that we have allocated and then keep track of how many of them have been used this frame. At the end of the frame when we’re done with them, we just reset the used index to 0 without releasing any of the memory to the system and we can carry on.
The other big problem is in how we build the mesh. This is a very similar problem to the one above, where we build a buffer of vertices, colors, and triangles which are then passed over to Unity as the final mesh. In the implementation as is, these lists were created fresh each frame which ends up wasting a lot of time allocating and then collecting memory. This sounds a lot like the problem we are seeing! All that’s left now is just fixing the implementation. There was a little tricky part that I encountered where reading a property of a mesh was actually copying the data which is what I was trying to avoid. I did a little research in the docs and found that there’s another API that doesn’t allocate which is exactly what I was looking for. After fixing all this stuff up, it’s time for another test.
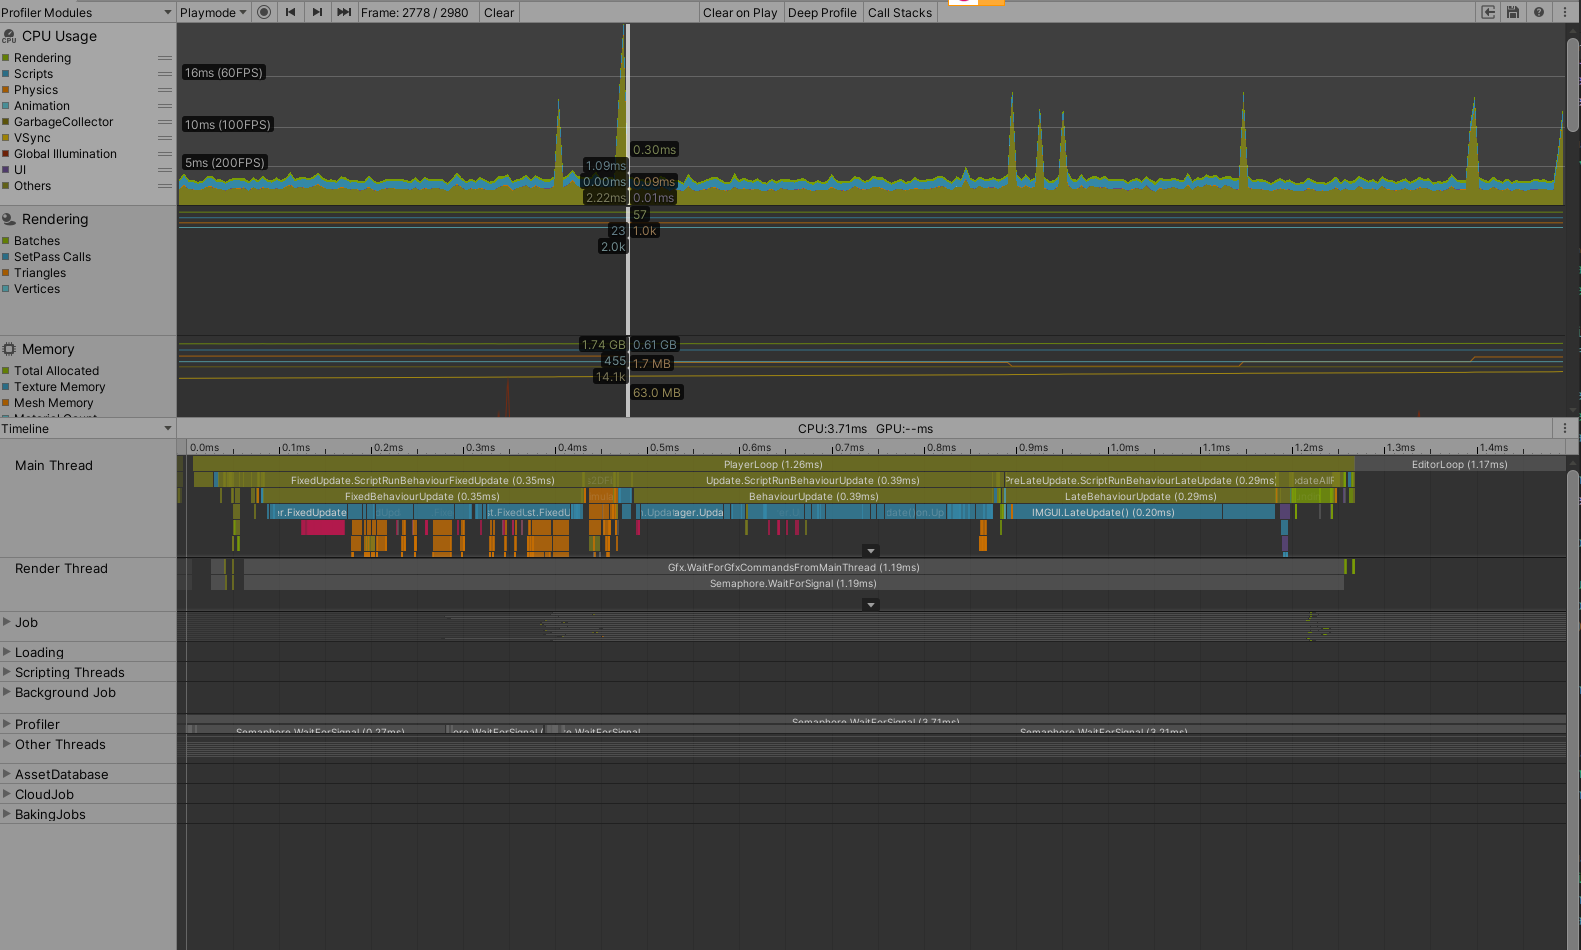
And there we are! So much smoother. You can see that we’re down to 0.2ms for the IMGUI call now which shows that we save a bunch of time just not allocating as well as all the time for garbage collection.
This brings me to the end of this particular optimization adventure. If you like what you’re reading, please consider wishlisting Blightmare on Steam and be sure to follow us on Twitter to make sure you get all the latest updates. Thanks for reading!