
Hello and welcome to another installment of the Blightmare Dev Blog! Today I’m going to show a quick debugging session to demonstrate how useful visualizing a problem can be.
Yesterday at our weekly meeting, Nick the level designer, mentioned that there was something funky going on with our caterpillars. I asked for a little more information like which type of cat, which level, and any other details so that I could start working out how to figure out the problem. Nick sent over this picture which showed that there was definitely a problem:
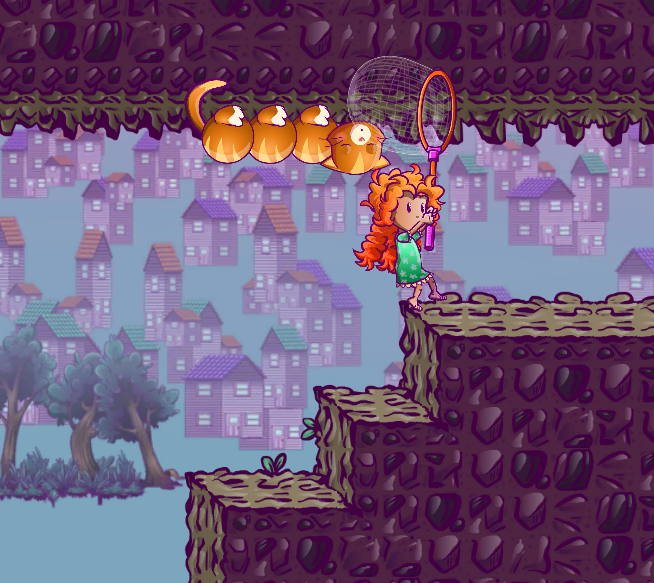
So now that we know there is a problem and what it looks like, the first step for me to fix it is to reproduce it for myself so that I can actually look at the code while it’s running in the broken state and then eventually test the fix to make sure it’s working.
I fired up our editor and loaded into the level Nick mentioned. This cat is right at the start, and in this case it was super easy to reproduce:
Okay, now that I can actually take a look at the problem and reproduce it myself I can start to formulate an idea of what’s going on. It’s pretty clear to see that the offset used to compute where Blissa hangs from the cat is wrong. In the code that offset is managed by a component called HangTarget (clever I know). So I opened that up to take a look at what might be going on. Just looking at it, the code seemed to be okay, and it turns out this little bit of logic hasn’t changed in quite a while so I was a little skeptical that it was really to blame. Typically the next step would be to startup the debugger and step through the code to really make sure the logic is correct. The problem with that in this case is there’s a big dependence on the data values for many of the features, so it’s pretty difficult to just step through and verify the values are correct.
Now that we can reproduce it in full context, I typically like to try to isolate the problem in a small scale test where I can control (remove) many of the other variables like other mechanics and ensure the test case is easy to do. To do that, I built myself a test level which confirms the problem and shows that it happens in many configurations of our Caterpillars:
What would be great is if I could actually see what the code thought it was doing. In this case there’s several virtual “points” that exist logically but don’t have any representation in the art. Something is wrong with some or all of these logical points and what I want to be able to do is visualize them along with the game art to verify that everything is in the correct place. In general I would refer to this kind of thing as “debug drawing” and you’ve seen it on this blog before in the hair post.
Unfortunately, the built-in debug drawing mechanisms in Unity leave a lot to be desired. In particular, there’s a way to draw “gizmos” in the editor which have pretty good support for toggling them on/off or styling them in various ways, but as far as I can tell, gizmos can only be represented by lines that are a single pixel wide – regardless of the zoom level. This makes it incredibly difficult to see them in many cases and it annoys me. When that happens, I often resort to building something myself that does what I want it to do. This is no exception.
What I want to be able to do is draw something that is always “on top” without having to do a lot of setup work or coding. What I built is a simple “immediate mode” drawing API. “Immediate mode” in this case means that when you tell the API to draw something you have to tell it all of the information about what you want to draw and it will do it this frame (immediately) and then forget about it. One of the advantages of a system like this is simplicity. I can just tell the system to draw whatever I want, whenever I want, and not have to worry about resources or synchronizing positions or other state when they change in the game logic. In Unity I implemented this as a “singleton” component that generates a mesh dynamically every frame with whatever drawing commands it received that frame and then submits it to be rendered. Here it is in action:
You can see the net swing has a tracer in this video. Now you may recall that I said the drawing API doesn’t have any memory, so how could it know how to do something that fades out over several frames?! The answer is simple: it doesn’t. The logic for the net swing actually manages that state and is requesting draw commands for swing positions that happened in the past. This is perhaps slightly more complex than some scheme where the debug API knew how to do this particular use case, but it has the advantage of keeping the state in the place that knows what it means and therefore can describe exactly what it wants to do with it.
Now that we have this ability, lets apply it to our cats. I decided to draw a purple box around the hang collider and a yellow square where the hang point claims to be. It didn’t exactly go as planned the first time:
So this obviously looks very wrong and I was expecting it to be wrong, but not this wrong. This looks more like I’ve implemented the debug drawing wrong. Such is life when you roll your own code sometimes. But, it’s not big deal to fix that up. In this case, the debug drawing code was not the problem, I just got confused about what coordinate system the hang target is actually in and was then drawing it in the wrong place. Once that was fixed, I visualized a little more about the hang targets: the direction that they allow hanging from. The yellow arrows points to the side of the hang target that the player needs to be in order to be allowed to hang. I also added a tracer line to show the path that Blissa will take when she starts hanging. This is green for a valid hang or red for a failure. Take a look:
So now we’re starting to get somewhere. While I was fixing the debug drawing, I noticed that the valid hang direction was not being initialized properly when a level was loaded, so that is corrected already by this time. It’s pretty clear to see that the hang target for the caterpillar on the right side is wrong – it’s inside the wall! That is just an offset which is pretty easy to tweak – once you know to do it. After fixing that value and playing with the offsets for the other configurations a little bit, we have the final working version in our test level:
Now the only thing left to do is verify that the fix actually works in the original context. Turns out that it does:
This change then gets committed to the codebase and when it finishes building, an updated editor gets uploaded for the team to use. Bug squashed.
Thanks for reading! If you’re enjoying these posts and want to check out the game when it’s ready, please stop over to Steam and wishlist Blightmare. Updates are also posted to Twitter; please give us a follow!